The growth index measures the predictability and strength of the company's annual sales and earnings growth on a scale of 1 to 10. A minimum of 3.4 is required and 6.7 or greater is desirable.
Sales growth is important because, over the long term, it determines the all-important growth of earnings. Factors that might allow earnings to grow faster (or slower) than the revenues that produce them are generally short-term in nature.
Our primary interest is in the "bottom line"—earnings per share—because that's what drives our stock price. So you'll want to watch both sales and earnings growth carefully to make sure they can satisfactorily increase the value of your investment.
Growth has two important attributes: Predictability and Strength.
Predictability
Predictability is important because you rely upon historical performance to forecast future performance. If you can tell the difference between a straight and a crooked line, you can see at a glance if the company's sales and earnings growth is steady enough to be predictable. The straighter the lines, the more confidence you can have in a prediction of future growth.
Note the value that's attached to the little "seismograph" graphic on this screen. This is the rating of the predictability or steadiness of the growth of sales and earnings respectively.
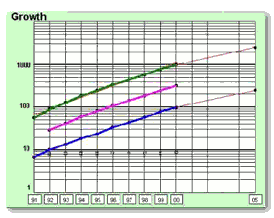
Take a look at the front page of the Technamental Stock Study Worksheet for a company. In the Growth section, you'll see the graph that tells the whole story. The predictability rating is associated with the most recent seven years of plotted data (the line describing sales growth is green, pre-tax profit is magenta, and earnings per share is blue). You'll find the "Stability" ratings to the right of the chart as well as on Growth analysis screen. You'll want to consider only companies whose predictability measures more than 8.5 (the rating will be shown in a yellow frame) and those whose predictability rates better than 9.5 are most desirable (a green frame).
As you do your stock studies, learn to associate the numerical values with the lines you see. Soon you'll be able to tell just by looking at the line about what the rating might be. If you look at the examples below, you'll see what we mean by straight versus crooked lines.

The growth chart above is that of an excellent company. The predictability ratings for this company's sales and earnings are both perfect 10s. You can easily see that the lines are straight, and those showing the projection into the future are very close to the historical rate of growth. This is as good as it gets.

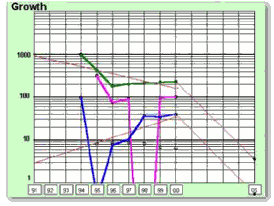
The chart above goes to the other extreme. This company's sales predictability is rated at 4.8. Earnings predictability is only 1.1. You would, of course, have no interest in considering the second company for investment. Forecasts will hardly be reliable. Not all companies are going to be this obvious. In your quest for excellent companies, it's best to accept few that rate below a 9.5, or, if everything else looks good, perhaps a 90.
Strength
As you have learned, sales and earnings growth rates are what determine the rate at which the value of your investment in the company can grow. You can also see at a glance whether the red trend lines are sloping up, from left to right, as they are in the first example; or down, as sales are in the second.
Depending upon the size of the company (measured in terms of annual revenues), Take Stock calculates both minimum acceptable and desirable growth rates. The minimum acceptable rates range from a low of 7 percent for larger companies to 14.9 percent and over for the smaller ones. These acceptable rates compensate for the additional risk you take when you invest in smaller companies.
Desirable rates range from 14.9 percent for a large company to more than 20 percent for a small one, since you're hoping to at least double your money every five years; and since, once again, you demand more from a smaller, less mature company.
Historical Growth
Shows the growth rates over the past ten years (if that much data is available), after irrelevant data has been removed. It's this analysis that is used as a starting point to conservatively estimate future growth.
Recent Growth
Shows the rate of growth for past 12 months. It flags any recent change and has the same requirements as historical growth. We look at recent growth to determine if there are any changes that might influence our decision. If recent growth is not satisfactory, it's a very good idea to look at the quarterly growth on the Technamental Stock Study Worksheet to analyze the individual quarters. They are displayed there, just above the growth chart, with the rates of change between each quarter and its counterpart the preceding year. Note especially if any trend is apparent in the four quarters that make up the last twelve months and don't buy a stock when the trend in growth is down for any significant, long-term reason.